TIDUF27A February 2025 – March 2025 AMC131M03 , MSPM0G1507
- 1
- Description
- Resources
- Features
- Applications
- 6
- 1System Description
-
2System Overview
- 2.1 Block Diagram
- 2.2
Design Considerations
- 2.2.1 Voltage Measurement Analog Front End
- 2.2.2 Analog Front End for Current Measurement
- 2.2.3 XDS110 Emulator
- 2.2.4 Bluetooth? Data Transmission
- 2.2.5 Bluetooth? Connection Between Two Modules
- 2.2.6 Bluetooth? to UART Connection
- 2.2.7 Magnetic Tamper Detection With TMAG5273 Linear 3D Hall-Effect Sensor
- 2.3 Highlighted Products
- 3Hardware, Software, Testing Requirements, and Test Results
- 4Design and Documentation Support
- 5About the Author
- 6Revision History
3.4.2 Radiated Emissions Performance
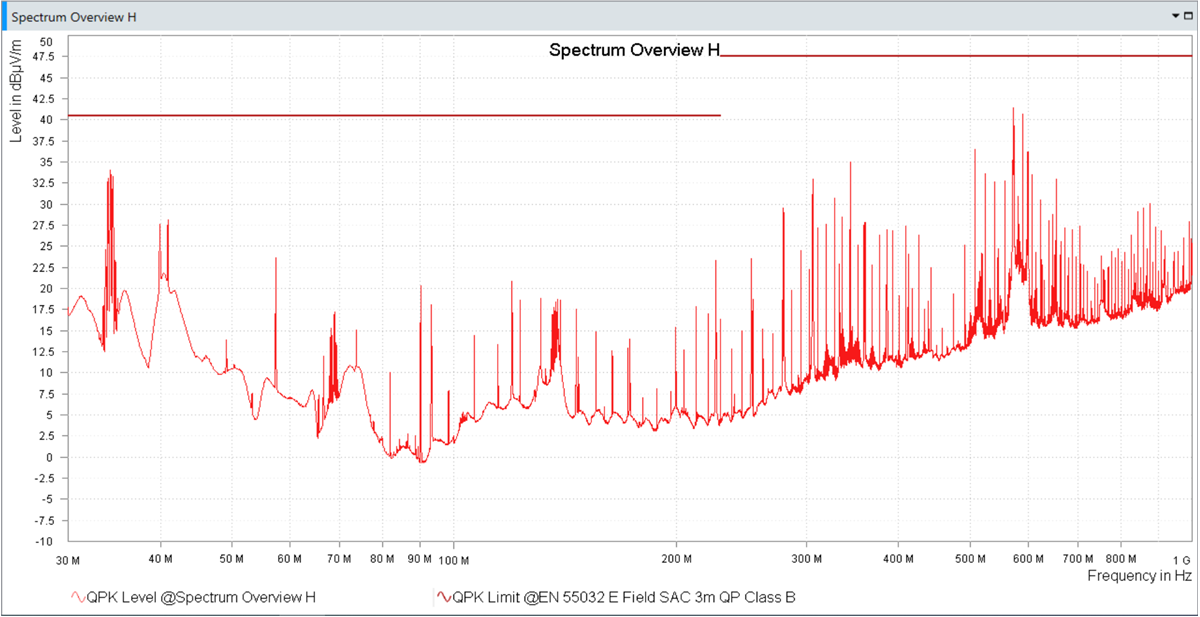
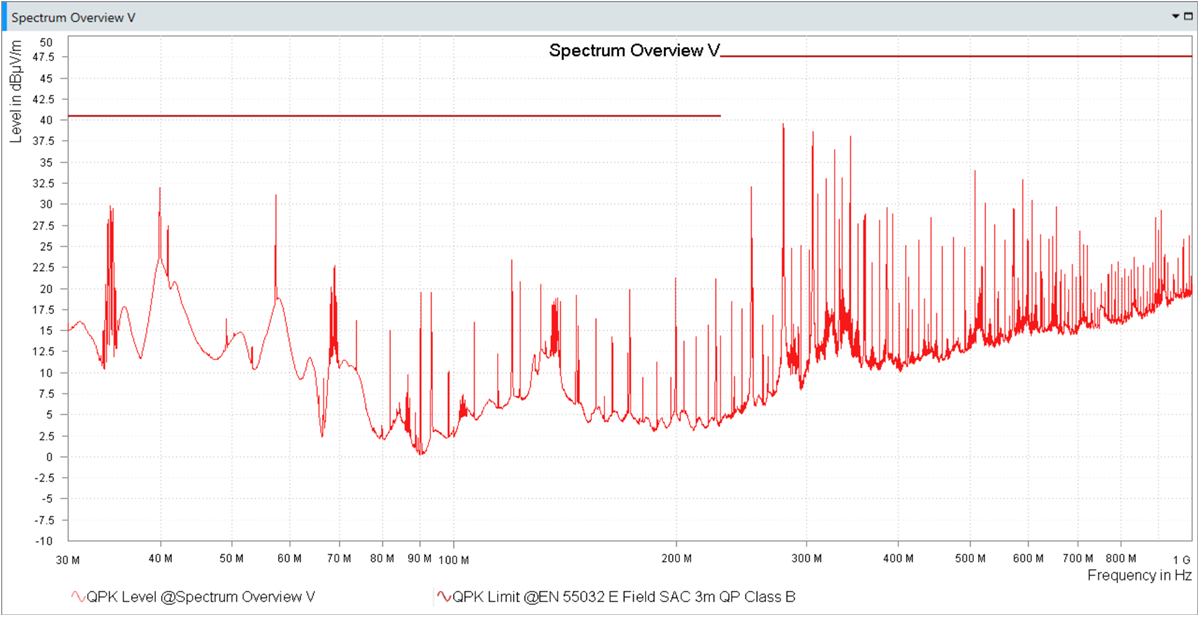
The plots in Figure 3-7 and Figure 3-8 are captured in a 3m CISPR chamber with a JB3 antenna in accordance to the EN50022 standard. Both plots show a quasi-peak capture of Radiated Emissions (RE) from the TIDA-010244 when the antenna is either in the Horizontal or in the Vertical position and are labeled with Spectrum Overview H and Spectrum Overview V, respectively. Within each capture the board is positioned up vertically (top of device facing antenna), connected to the line, but without a load. The antenna is positioned at 0m and 1m, with the antenna at board level and 1m above board level in height. Multiple board rotations (0, 90, 180, 270) are also captured within each plot. Across the antenna height and board orientation conditions, only the highest emission peaks are shown on the plots.
The radiated emissions of the TIDA-010244 come from two main sources: the Digital SPI signals and the internal DC-DC transformer of each AMC device. The digital CLKIN signal is running at 8.192MHz and the harmonics are visible across the Emission spectrum. The SPI communication also radiates, causing wider and smaller peaks in the lower half of the frequency range due to the irregular period. Another set of emission peaks comes from the internal DC-DC transformer of the AMC devices which operate in the approximate 32MHz range. These emissions are amplified by the connection to the grid, which creates an antenna for the DC-DC fundamental to radiate through. Ferrites are added between the AMC device inputs and the line connection to block the DC-DC fundamental from propagating to the line and reduce the emissions. TIDA-010244 is battery-powered during the RE tests.
 Figure 3-7 Spectrum Overview H
 Figure 3-8 Spectrum Overview V